Overview
Bedrock provides real-time performance monitoring and detailed reporting across all campaigns, line items, and creatives. Reports are available directly in the platform UI and through Arctus, Bedrock’s advanced analytics integration.
In-Platform Reporting
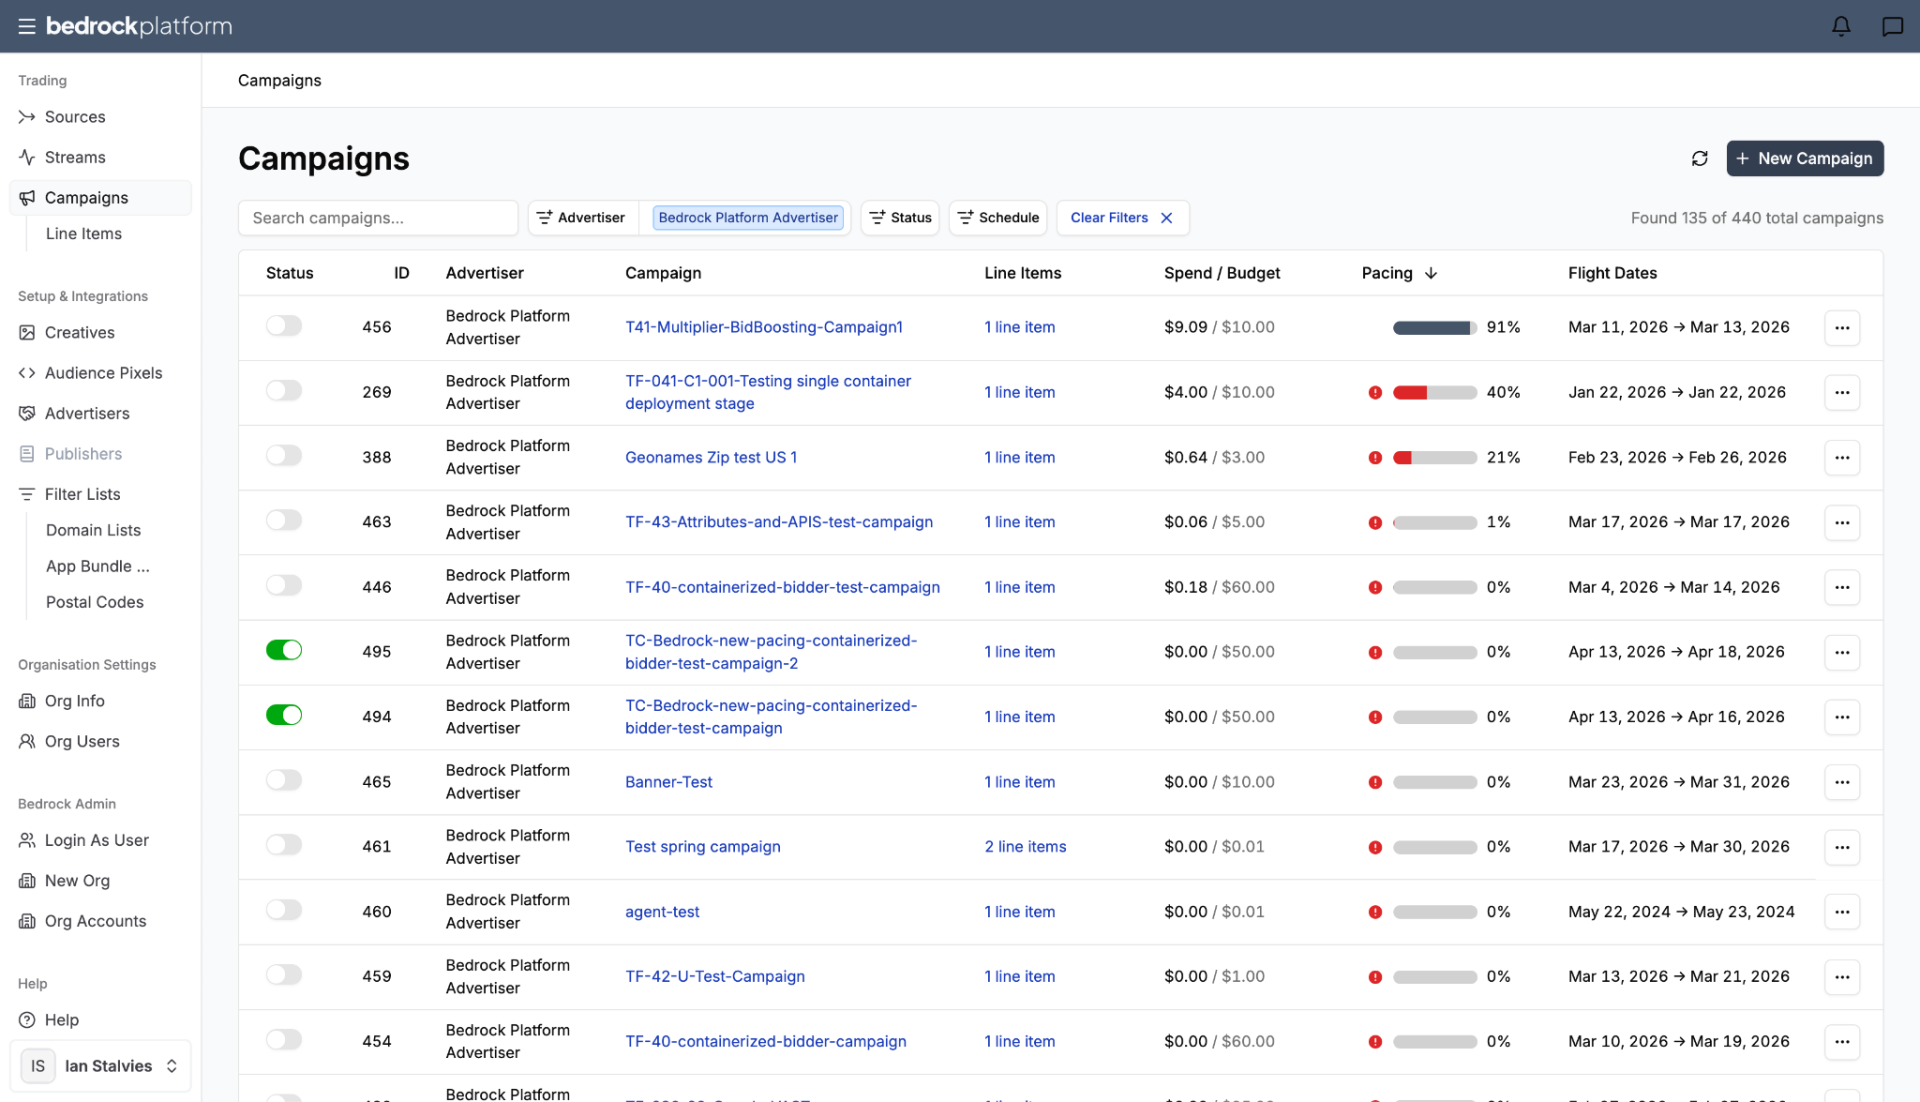
Campaign-Level Metrics
The Campaigns page shows live performance data for every campaign:
| Metric | Description |
|---|---|
| Spend to Date / Budget | Current spend vs. total budget |
| Pacing | How the campaign is tracking against its schedule (color-coded) |
| Total Bids | Number of bid requests processed |
| Total Impressions | Impressions won and served |
| Win Rate | Percentage of bids that won (impressions / bids) |
| Clicks | Total clicks on your ads |
| Conversions | Conversion events tracked via pixels |
| CTR | Click-through rate (clicks / impressions) |
Line Item-Level Metrics
Drill down to individual line items for more granular data:
| Metric | Description |
|---|---|
| Base Bid | The starting bid price |
| Spend to Date / Budget | Line item-specific spend |
| Pacing | Line item pacing indicator |
| Total Bids / Impressions | Volume at the line item level |
Pacing Indicators
| Color | Meaning |
|---|---|
| Black | On track |
| Orange | Significantly behind |
| Red | Critically behind — action needed |
Customizing Views
- Use the Columns button to add or remove metrics from any table.
- Filter by Advertiser or Campaign to focus on specific activity.
- Use the search bar to find campaigns or line items by name.
Key Metrics Explained
Volume Metrics
- Bids — total bid requests the platform processed for your campaign.
- Impressions — bids that won and resulted in an ad being served.
- Valid Impressions — impressions verified as legitimate (filtered for invalid traffic).
- Clicks — user clicks on your ads.
- Valid Clicks — clicks verified as legitimate user interactions.
Financial Metrics
- Media Spend — the cost of impressions served.
- Total Spend — all costs including media, data fees, and platform fees.
- CPM — cost per thousand impressions (total spend / impressions × 1,000).
- CPA — cost per acquisition (total spend / conversions).
- CTR — click-through rate (clicks / impressions × 100).
Performance Metrics
- Win Rate — percentage of bids that resulted in a won impression.
- Conversions — tracked conversion events (requires pixel setup).
- CPA — cost per conversion.
Arctus Integration
Arctus is Bedrock’s advanced analytics platform, providing deeper reporting capabilities:
- Cross-dimensional analysis — break down performance by multiple dimensions simultaneously (geo, device, time, creative).
- Custom date ranges — analyze performance over any time period.
- Export — download reports in CSV or Excel format.
- Comparative reports — compare performance across campaigns, time periods, or targeting strategies.
- Real-time dashboards — live updating views of campaign performance.
For more information on Arctus please raise with your account manager.
Multi-Currency Support
Bedrock supports reporting in multiple currencies. Campaign budgets and spend can be set and viewed in your preferred currency.
Best Practices
- Check pacing daily during the first week of a new campaign — early pacing issues are easier to fix.
- Use win rate to diagnose delivery issues — a very low win rate suggests your bid is too low for the inventory.
- Monitor CTR to assess creative performance — if CTR drops, consider refreshing creatives.
- Set up conversion pixels before launch to measure ROI from day one.